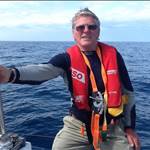
Most of you will never have heard of Ontong Java, I certainly hadn't before a chance meeting with a film maker. Its a long way away from any significant hub, has no airstrip or regular shipping and is pretty much self-sufficient. I anchored off the village of Pelau for a couple of weeks and spent every day ashore with the villagers. A truly unforgettable experience.
good work Dexport !! those images and stories should help us all understand that sea levels are rising . And maybe we can make changes to our lives that may help slow that down .
Really loving your whole Solomon Islands adventure Dex. Have to admit I usually feel resentment of you after each episode, but that's something I'm dealing with ![]() .
.
Select to expand quoteSandS said..
good work Dexport !! those images and stories should help us all understand that sea levels are rising . And maybe we can make changes to our lives that may help slow that down .
Thanks SandS. I think the boat has already sailed(pun intended), theres nothing that we're doing that will make any difference. Only people with nothing to lose are willing to make big changes, everyone else is so scared to lose what they have and it will always come back to economics. If theres easy money to be made with planet saving then the big dogs will be all over it, but for now, raping the natural resources is the easiest way to increases the billions.
Select to expand quoteWander66 said..
Really loving your whole Solomon Islands adventure Dex. Have to admit I usually feel resentment of you after each episode, but that's something I'm dealing with ![]() .
.
Hi Wander, thanks and sorry. Admitting it is the first step to recovery.
Select to expand quoteDexport said..SandS said..
good work Dexport !! those images and stories should help us all understand that sea levels are rising . And maybe we can make changes to our lives that may help slow that down .
Thanks SandS. I think the boat has already sailed(pun intended), theres nothing that we're doing that will make any difference. Only people with nothing to lose are willing to make big changes, everyone else is so scared to lose what they have and it will always come back to economics. If theres easy money to be made with planet saving then the big dogs will be all over it, but for now, raping the natural resources is the easiest way to increases the billions.
Yes, too many greed ridden scumbags wanting more zeros in their bank accounts and too many governments wanting their cut and none of them giving a damn about what it's doing... But what are they going to do with all their money when the planet is finally totally screwed and uninhabitable??
Select to expand quoteCockpit said..Dexport said..SandS said..
good work Dexport !! those images and stories should help us all understand that sea levels are rising . And maybe we can make changes to our lives that may help slow that down .
Thanks SandS. I think the boat has already sailed(pun intended), theres nothing that we're doing that will make any difference. Only people with nothing to lose are willing to make big changes, everyone else is so scared to lose what they have and it will always come back to economics. If theres easy money to be made with planet saving then the big dogs will be all over it, but for now, raping the natural resources is the easiest way to increases the billions.
Yes, too many greed ridden scumbags wanting more zeros in their bank accounts and too many governments wanting their cut and none of them giving a damn about what it's doing... But what are they going to do with all their money when the planet is finally totally screwed and uninhabitable??
That's why the billionaires are getting ready to settle Mars![]()
Select to expand quoteWander66 said..Cockpit said..Dexport said..SandS said..
good work Dexport !! those images and stories should help us all understand that sea levels are rising . And maybe we can make changes to our lives that may help slow that down .
Thanks SandS. I think the boat has already sailed(pun intended), theres nothing that we're doing that will make any difference. Only people with nothing to lose are willing to make big changes, everyone else is so scared to lose what they have and it will always come back to economics. If theres easy money to be made with planet saving then the big dogs will be all over it, but for now, raping the natural resources is the easiest way to increases the billions.
Yes, too many greed ridden scumbags wanting more zeros in their bank accounts and too many governments wanting their cut and none of them giving a damn about what it's doing... But what are they going to do with all their money when the planet is finally totally screwed and uninhabitable??
That's why the billionaires are getting ready to settle Mars![]()
reminds me of the Philip K Dick story "Survey Team"...
philipkdickreview.wordpress.com/2014/05/12/survey-team/
Select to expand quoteSandS said..
those images and stories should help us all understand that sea levels are rising .
Not quite with you there SandS.
Do the recorded tidal observations at say Fort Denison in Sydney Harbour or the observation point in Port Phillip Bay over the last 100 odd years CONFIRM that sea levels ARE rising, or, are rising sea levels just a local anomaly at the Pacific islands and Bangladesh???????
Select to expand quotecisco said..SandS said..
those images and stories should help us all understand that sea levels are rising .
Not quite with you there SandS.
Do the recorded tidal observations at say Fort Denison in Sydney Harbour or the observation point in Port Phillip Bay over the last 100 odd years CONFIRM that sea levels ARE rising, or, are rising sea levels just a local anomaly at the Pacific islands and Bangladesh???????
I dont know cisco , i would have to google it ...... glaciers are melting and arctic ice is retreating , i know that to be a fact .
Great stuff. Sorry to hear of the loss of the video - memory card failure? I learnt the hard way about 10 years ago when my backup device was full and I thought it would be OK until I left Egypt. I was wrong, a card failed and took 2,000 images with. I was eventually able to get 1,800 recovered by a firm in the UK but lost everything I took in the Valley of the Kings. Lesson: you cannot have too many backups.
Tim
Select to expand quotecisco said..SandS said..
those images and stories should help us all understand that sea levels are rising .
Not quite with you there SandS.
Do the recorded tidal observations at say Fort Denison in Sydney Harbour or the observation point in Port Phillip Bay over the last 100 odd years CONFIRM that sea levels ARE rising, or, are rising sea levels just a local anomaly at the Pacific islands and Bangladesh???????
So if you hear thunder and look to the east and see no storm do you assume there is no storm or do you perhaps look to the North, South or West as well?
The following is from a paper by Ben Modra from the Manly Hydraulics Laboratory who manage most of the tide gauges in NSW, the link to the paper is below.
The Fort Denison tidal dataset managed by Sydney Ports Corporation is one of the most valued tidal records in Australia, and is invaluable when addressing long-term changes to east Australian water level, and the south-west Pacific Ocean state. For this analysis it provides a context in which to interpret long-term levels of the OEH network of tide gauges. Figure 4 shows monthly average and yearly averaged water level data from Fort Denison. The record has not been adjusted for anomaly drivers (such as MSLP), so represents the measured water level at the gauge. The long-term sea level trend of 0.94 mm/year is clearly apparent, as are variations to the average rate of rise.
The last 20-year period, covering the data range of the other MHL gauging sites, is associated with sustained El Nino conditions, generally associated with drier, less stormy conditions in Australia. This causes a depressing of regional sea levels and is seen as a slowing of sea level rise in the Fort Denison data to 0.4 mm/year for 1986- 2007 (MHL1881). This would imply that gauges across NSW with datasets of approximately 20 years will underestimate sea level rise.
new.mhl.nsw.gov.au/docs/tide/NSW%20Coastal%20Conference%202011%20OceanWaterLevels.pdf
I'll be working at the Manly Hydraulics lab next week and will track Ben down for a discussion on this matter.
The following is from CSIRO's State of the Climate 2018:
? Australia's climate has warmed by just over 1 ?C since 1910, leading to an increase in the frequency of extreme heat events.
? Oceans around Australia have warmed by around 1 ?C since 1910, contributing to longer and more frequent marine heatwaves.
? Sea levels are rising around Australia, increasing the risk of inundation.
? The oceans around Australia are acidifying (the pH is decreasing).
? April to October rainfall has decreased in the southwest of Australia. Across the same region May-July rainfall has seen the largest decrease, by around 20 per cent since 1970.
? There has been a decline of around 11 per cent in April-October rainfall in the southeast of Australia since the late 1990s.
? Rainfall has increased across parts of northern Australia since the 1970s.
? Streamflow has decreased across southern Australia. Streamflow has increased in northern Australia where rainfall has increased.
? There has been a long-term increase in extreme fire weather, and in the length of the fire season, across large parts of Australia.
www.csiro.au/en/Showcase/state-of-the-climate
Select to expand quotecisco said..SandS said..
those images and stories should help us all understand that sea levels are rising .
Not quite with you there SandS.
Do the recorded tidal observations at say Fort Denison in Sydney Harbour or the observation point in Port Phillip Bay over the last 100 odd years CONFIRM that sea levels ARE rising, or, are rising sea levels just a local anomaly at the Pacific islands and Bangladesh???????
Sea levels generally rise in proportion to the dysfunctionalality of a region, and the more those dysfunctional regions can benefit from guilting wealthy regions out of money, the greater the effects of sea level rises are recorded.
Select to expand quoteWander66 said..cisco said..SandS said..
those images and stories should help us all understand that sea levels are rising .
Not quite with you there SandS.
Do the recorded tidal observations at say Fort Denison in Sydney Harbour or the observation point in Port Phillip Bay over the last 100 odd years CONFIRM that sea levels ARE rising, or, are rising sea levels just a local anomaly at the Pacific islands and Bangladesh???????
So if you hear thunder and look to the east and see no storm do you assume there is no storm or do you perhaps look to the North, South or West as well?
The following is from a paper by Ben Modra from the Manly Hydraulics Laboratory who manage most of the tide gauges in NSW, the link to the paper is below.
The Fort Denison tidal dataset managed by Sydney Ports Corporation is one of the most valued tidal records in Australia, and is invaluable when addressing long-term changes to east Australian water level, and the south-west Pacific Ocean state. For this analysis it provides a context in which to interpret long-term levels of the OEH network of tide gauges. Figure 4 shows monthly average and yearly averaged water level data from Fort Denison. The record has not been adjusted for anomaly drivers (such as MSLP), so represents the measured water level at the gauge. The long-term sea level trend of 0.94 mm/year is clearly apparent, as are variations to the average rate of rise.
The last 20-year period, covering the data range of the other MHL gauging sites, is associated with sustained El Nino conditions, generally associated with drier, less stormy conditions in Australia. This causes a depressing of regional sea levels and is seen as a slowing of sea level rise in the Fort Denison data to 0.4 mm/year for 1986- 2007 (MHL1881). This would imply that gauges across NSW with datasets of approximately 20 years will underestimate sea level rise.
new.mhl.nsw.gov.au/docs/tide/NSW%20Coastal%20Conference%202011%20OceanWaterLevels.pdf
I'll be working at the Manly Hydraulics lab next week and will track Ben down for a discussion on this matter.
The following is from CSIRO's State of the Climate 2018:
? Australia's climate has warmed by just over 1 ?C since 1910, leading to an increase in the frequency of extreme heat events.
? Oceans around Australia have warmed by around 1 ?C since 1910, contributing to longer and more frequent marine heatwaves.
? Sea levels are rising around Australia, increasing the risk of inundation.
? The oceans around Australia are acidifying (the pH is decreasing).
? April to October rainfall has decreased in the southwest of Australia. Across the same region May-July rainfall has seen the largest decrease, by around 20 per cent since 1970.
? There has been a decline of around 11 per cent in April-October rainfall in the southeast of Australia since the late 1990s.
? Rainfall has increased across parts of northern Australia since the 1970s.
? Streamflow has decreased across southern Australia. Streamflow has increased in northern Australia where rainfall has increased.
? There has been a long-term increase in extreme fire weather, and in the length of the fire season, across large parts of Australia.
www.csiro.au/en/Showcase/state-of-the-climate
Well as an archaeologist I can say that that sea level rise is about the same that occurred after the last Ice Age when the sea rose to 6 metres above present sea levels 6,000 years ago. Mind you it took 17,000 years to rise about 36 metres from the Ice age maximum!
Since then (6,000 years ago) its being dropping, the last significant drop of about 1 metre was in 1100AD. That was not too long ago.
Any of us will be very unfortunate to see a significant change in sea levels.
I'll go with you on that one AshleyM. ![]()
It is funny how billions keep getting spent on real estate development in low lying coastal areas such as Sunny and Gold Coasts, Florida, New Orleans and the rest of the U.S. eastern seaboard and the ultra rich keep buying up Pacific islands.
"Climate Change" sounds like a con job to me.
Sorry for hijacking your thread Dexport. ![]() Enjoyed your vid by the way.
Enjoyed your vid by the way.
Select to expand quoteAshleyM said..cisco said..SandS said..
those images and stories should help us all understand that sea levels are rising .
Not quite with you there SandS.
Do the recorded tidal observations at say Fort Denison in Sydney Harbour or the observation point in Port Phillip Bay over the last 100 odd years CONFIRM that sea levels ARE rising, or, are rising sea levels just a local anomaly at the Pacific islands and Bangladesh???????
Sea levels generally rise in proportion to the dysfunctionalality of a region, and the more those dysfunctional regions can benefit from guilting wealthy regions out of money, the greater the effects of sea level rises are recorded.
Perhaps you could elucidate AshleyM......?
Sea levels rising means more water to sail in.
Flippant?
Of course it is, but I'm doing my bit by drinking one less stubby per month.
Select to expand quotenswsailor said..
Any of us will be very unfortunate to see a significant change in sea levels.
i would say very fortunate, as in living for the next 200 years.
Select to expand quotecisco said..
I'll go with you on that one AshleyM. ![]()
It is funny how billions keep getting spent on real estate development in low lying coastal areas such as Sunny and Gold Coasts, Florida, New Orleans and the rest of the U.S. eastern seaboard and the ultra rich keep buying up Pacific islands.
"Climate Change" sounds like a con job to me.
Sorry for hijacking your thread Dexport. ![]() Enjoyed your vid by the way.
Enjoyed your vid by the way.
There is ample data that demonstrates sea level rise is occurring, and if we accept that there are other locations outside of Fort Dennison you will also see that this is occurring at different rates in different areas. Things also to be kept in mind with interpreting sea level rise, in many locations we are also seeing land subsidence, which also results in similar impacts. Places like the Pacific islands and others will bear the brunt of this part of climate change first and also have the least means to deal with it either through coastal adaptation or relocation (enter key points here with boat arrivals to their nearest neighbor).
The fact that climate change is even being debated as to whether its happening or not and whether its due to people is a disgrace about our society and the way that media and our politicians manipulate science for decision making and denial of hard decisions that may cost votes.
Truly inspirational video and I hope to see this with my family in a few years time, so please show us some other gems in that region as its on my list for our sailing sea-batical.
Select to expand quoteCockpit said..
Plus one on what you said dralyagmas.
Me too...
So if you guys live for another 20 years the sea will rise 20mm!
Big deal.
Get real guys, sea rise and fall, a natural occurrence, is not going to effect you in your lifetime.
Select to expand quotedralyagmas said..cisco said..
I'll go with you on that one AshleyM. ![]()
It is funny how billions keep getting spent on real estate development in low lying coastal areas such as Sunny and Gold Coasts, Florida, New Orleans and the rest of the U.S. eastern seaboard and the ultra rich keep buying up Pacific islands.
"Climate Change" sounds like a con job to me.
Sorry for hijacking your thread Dexport. ![]() Enjoyed your vid by the way.
Enjoyed your vid by the way.
There is ample data that demonstrates sea level rise is occurring, and if we accept that there are other locations outside of Fort Dennison you will also see that this is occurring at different rates in different areas. Things also to be kept in mind with interpreting sea level rise, in many locations we are also seeing land subsidence, which also results in similar impacts. Places like the Pacific islands and others will bear the brunt of this part of climate change first and also have the least means to deal with it either through coastal adaptation or relocation (enter key points here with boat arrivals to their nearest neighbor).
The fact that climate change is even being debated as to whether its happening or not and whether its due to people is a disgrace about our society and the way that media and our politicians manipulate science for decision making and denial of hard decisions that may cost votes.
Truly inspirational video and I hope to see this with my family in a few years time, so please show us some other gems in that region as its on my list for our sailing sea-batical.
Thanks! A good comment and I totally agree with you. The people out on these remote atolls are very worried. Thats why I was so upset about loosing all the footage as it contained so much important footage. I interviewed 20 village members, young and old and the whole emphasis was on global warming, pollution and the future. These are very simple people with a limited understanding of global goings-on. For example, when I showed them my satellite images of their island they didn't recognise it at all, they'd not seen that perspective. But they have a very beautiful life, very pure. There are no retirement homes, no kids taking meds for ADD etc, no phones or playstations, no crime, no depressive or suicidal people, very little sickness at all, they have a nurse with very rudimentary means and training but they are HAPPY! They are looking towards the possibility of a gradual relocation to Malaita but that will mean loosing their culture as they will become immigrants and be treated and such. They will be unsuitable to "normal" life and they have no training or capitalistic intentions, they don't understand the concept of possessions to a large degree. I worry for them.
At the farewell feast they put on the chief invited me back which was a huge honour but I sort of feel I have let them down by not making the documentary that would have don't them justice.
Glad you liked the video regardless of my cockup.
Select to expand quotenswsailor said..
So if you guys live for another 20 years the sea will rise 20mm!
Big deal.
Get real guys, sea rise and fall, a natural occurrence, is not going to effect you in your lifetime.
Yeah not really mate, thats a pretty basic way of looking at it. I think Climate change is a pretty dumb term that gets overused. The climate has never stopped changing but its the speed that unprecedented.
This change might not affect YOU much and if thats all you care about then cool.
Low-lying atolls for example have a very delicate water table. A slight increase in sea-levels and the fresh water becomes brackish, undrinkable. The roots of the vegetable that they totally rely on get burned by increased salt in the soil. On Ontong Java there are no longer any wells that they can drink from, they just use that water fro cooking and cleaning now and rely totally on rainwater and coconuts. In the last couple of generations they have lost 15-20m of coastline! Pretty significant when your island is only 100-200m wide.
You know Dexport, after watching your doco I really feel engaged to do something for these Island crew. Like running a yacht up there full of medical supplies, water filters and school gear. Ive thought about it before after reading other yachting people travelling to far flung islands that dont have regular visitors. Of the happiness of the islanders but also the need for some basics.
Really Im jealous of their lifestyle. The daily grind of living is really getting to me. At every corner it seems someone wants more than a dollar for their time and its just keeps getting more every day. We are now the richest nation on earth per person on average surpassing Switzerland this year but I dont think our peacefulness, gratefulness or care for each other is keeping pace.
Im still recovering from my spinal fractures but I am going to do this soon. Sadly I put my beachcat up for sale today but I think that feeling will be short lived.
If low lying islands subside into the sea, that can hardly be attributed to the alleged "global warming/climate change" widely attributed by the lying media as a result of human advancement over the last 200 years.
Tell a lie often enough, people will come to accept it as "truth".
It is a recorded fact that islands in the Pacific DO rise and fall due to volcanic and crustacial earth movement.
Surely we are all aware of the moving "hot spot" under Hawaii whereby islands to the north west disappear and islands appear to the south east. National Geographic I think.
The whole "climate change thing" is being used as a tool to tax the hell out of the common people while the multinationals continue to do what they have always done i.e. just make profit and to hell with the environment.
Plastic is the biggest threat to the environment but it is a byproduct of oil isn't it so keep pumping that crap out.
If you read "Worlds in Collision" by Immanuel Velikovsky and his other books you might gain an understanding that so called "climate change" is the least of our worries.
Humanity is just the current apex species in the passing parade. Maybe one eyed, one horned purple flying people eaters will be the next.
Select to expand quotecisco said..
If low lying islands subside into the sea, that can hardly be attributed to the alleged "global warming/climate change" widely attributed by the lying media as a result of human advancement over the last 200 years.
Tell a lie often enough, people will come to accept it as "truth".
It is a recorded fact that islands in the Pacific DO rise and fall due to volcanic and crustacial earth movement.
Surely we are all aware of the moving "hot spot" under Hawaii whereby islands to the north west disappear and islands appear to the south east. National Geographic I think.
The whole "climate change thing" is being used as a tool to tax the hell out of the common people while the multinationals continue to do what they have always done i.e. just make profit and to hell with the environment.
Plastic is the biggest threat to the environment but it is a byproduct of oil isn't it so keep pumping that crap out.
If you read "Worlds in Collision" by Immanuel Velikovsky and his other books you might gain an understanding that so called "climate change" is the least of our worries.
Humanity is just the current apex species in the passing parade. Maybe one eyed, one horned purple flying people eaters will be the next.
Gee hope your right Cisco ... but what if the evidence is hmm just that! See I've got 7 kids, and I just keep thinking what we leave them is what they get to work with - you know that's the richness of life that I got to experience.
I'm not sure it cuts it to argue that despite having the facts, data, modeling and evidence to know better, we still chose to do nothing. Again, what if your wrong - what do you tell your kids, grandkids then?
Select to expand quotesimmrr said..
You know Dexport, after watching your doco I really feel engaged to do something for these Island crew. Like running a yacht up there full of medical supplies, water filters and school gear. Ive thought about it before after reading other yachting people travelling to far flung islands that dont have regular visitors. Of the happiness of the islanders but also the need for some basics.
Really Im jealous of their lifestyle. The daily grind of living is really getting to me. At every corner it seems someone wants more than a dollar for their time and its just keeps getting more every day. We are now the richest nation on earth per person on average surpassing Switzerland this year but I dont think our peacefulness, gratefulness or care for each other is keeping pace.
Im still recovering from my spinal fractures but I am going to do this soon. Sadly I put my beachcat up for sale today but I think that feeling will be short lived.
Thank you too Dexport & simmr - you've just reminded me of my need to be more gracious and generous and to remember that I have so much privilege and to share my humanity - all the best with your spinal fractures & im going to research how/ what I can do to support our vulnerable neighbours.
Select to expand quotecisco said..
If low lying islands subside into the sea, that can hardly be attributed to the alleged "global warming/climate change" widely attributed by the lying media as a result of human advancement over the last 200 years.
Tell a lie often enough, people will come to accept it as "truth".
It is a recorded fact that islands in the Pacific DO rise and fall due to volcanic and crustacial earth movement.
Surely we are all aware of the moving "hot spot" under Hawaii whereby islands to the north west disappear and islands appear to the south east. National Geographic I think.
The whole "climate change thing" is being used as a tool to tax the hell out of the common people while the multinationals continue to do what they have always done i.e. just make profit and to hell with the environment.
Plastic is the biggest threat to the environment but it is a byproduct of oil isn't it so keep pumping that crap out.
If you read "Worlds in Collision" by Immanuel Velikovsky and his other books you might gain an understanding that so called "climate change" is the least of our worries.
Humanity is just the current apex species in the passing parade. Maybe one eyed, one horned purple flying people eaters will be the next.
Gee hope your right Cisco ... but what if the evidence is hmm just that! See I've got 7 kids, and I just keep thinking what we leave them is what they get to work with - you know that's the richness of life that I got to experience.
I'm not sure it cuts it to argue that despite having the facts, data, modeling and evidence to know better, we still chose to do nothing. Again, what if your wrong - what do you tell your kids, grandkids then?
Reef along the shoreline near Christchurch NZ is 2 meters above the water now after the earthquake!